MAX-CSP 2008 Competition: time to solve an instance
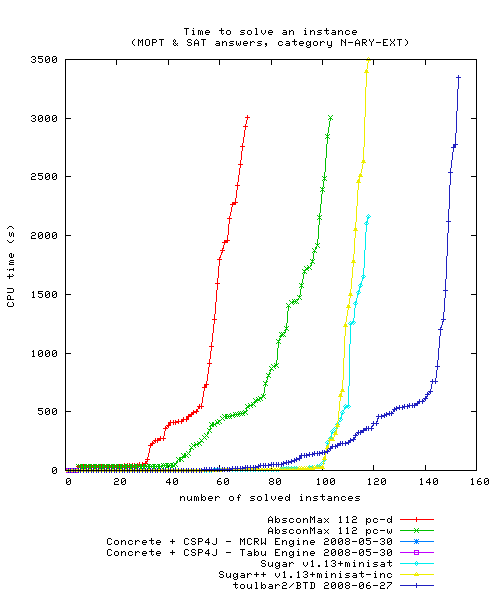
The figures below represent the number of instances that a given solver is able to solve in a given amount of time. The x axis represent the number of instances which the solver is able to solve when it is given y seconds for each instances.
These graphs are drawn for the different possible definitive answers in the different categories of benchmarks.
Category 2-ARY-EXT (instances with only binary constraints defined in extension)

Download the above graph
as a PDF file /
as an EPS file
|
Category 2-ARY-INT (instances with only binary constraints (some of them being defined by a predicate))

Download the above graph
as a PDF file /
as an EPS file
|
Category GLOBAL (instances containing some global constraints)

Download the above graph
as a PDF file /
as an EPS file
|
Category N-ARY-EXT (instances with some n-ary constraints (all constraints defined in extension))
Download the above graph
as a PDF file /
as an EPS file
|
Category N-ARY-INT (instances with some n-ary constraints and some constraints defined by a predicate))